Tableau Cycle Fields
Tableau Cycle Fields can be used to cycle the current included dimensions in the current Tableau sheet. This is very useful when you want to see the effect of different dimension variations. This feature is simulation for QlikView cyclic groups but in my opinion it require a lot of enhancements in Tableau to reach for the same level of QlikView Cyclic groups.
Key Concepts
Tableau Version: 10.X
Path: Analysis –> Cycle Fields
Shortcut: None
Tableau Cycle Fields, How it works?
Tableau Cycle Fields will cycle / rotate dimensions on the current worksheet. The best way to describe this is to do it by example. You can download “Supermarket” transaction Excel file and use Tableau to connect to this file in order to simulate what i will teach you in this article. You need to do the following steps to connect to Supermarket transactions Excel file
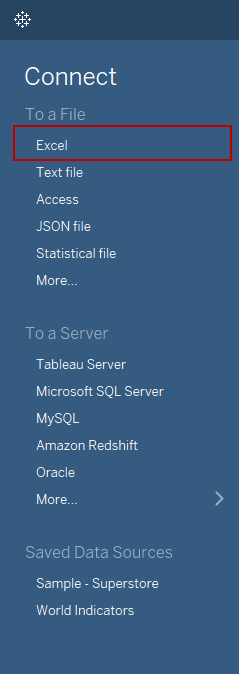
- Open Tableau
- Then, Select “Excel” from the left “Connect” panel. (Connect –> To File –> Excel)
- Finally, Navigate to “Supermarket” transaction Excel file and click on “Open”
Steps are illustrated in the following figure:
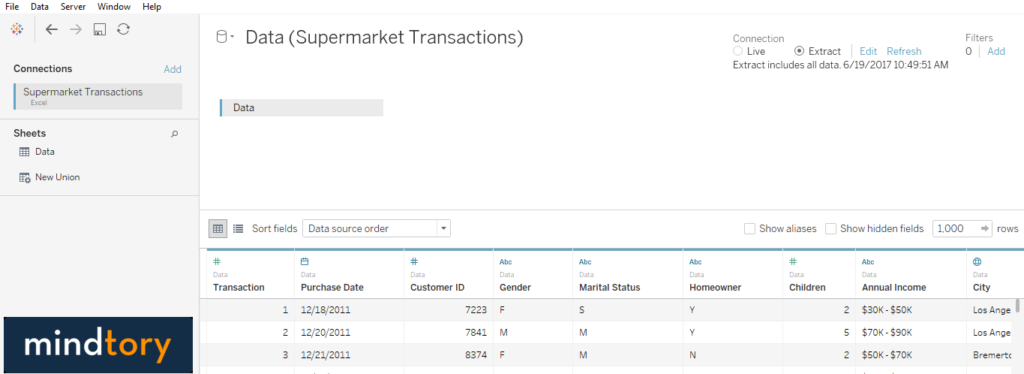
Your screen should look like the following screenshot:
 Then, let’s start creating a simple visualization:
- Click on “Sheet”
- Then, Drag “Marital Status” to the “Rows Shelf”
- Then, Drag “Gender” to the “Rows Shelf”
- After that, Drag “Annual Income” to the “Rows Shelf”
- Finally, Drag “Revenue” to the “Rows Shelf”
Note: You can also double click on a dimension or measure to quickly add them to your visualization instead of using drag and drop. Tableau will select the most appropriate location for your dimension or measure while you can exactly select a specific location if you are using “drag and drop”.
The following figure explain those steps in more details
Note: Cycle Fields will be disabled till you have more than 1 dimension in your visualization. You need at least 2 dimensions inorder to use Cycle fields in Tableau.
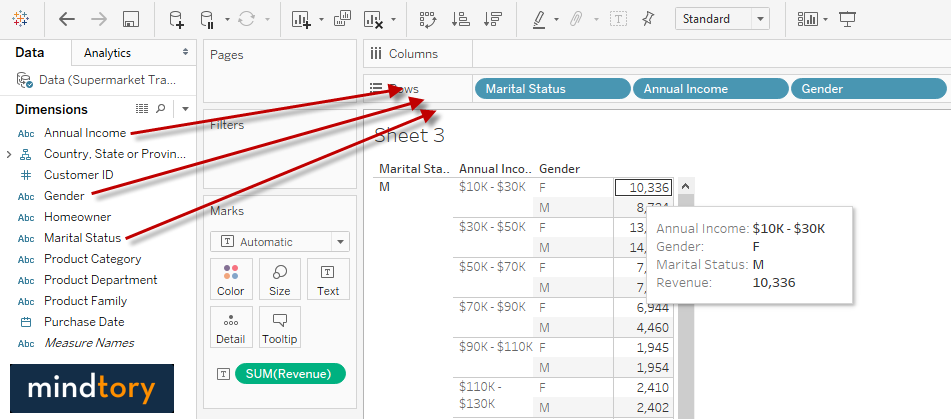
Note that the dimensions order is: Marital Status – Gender – Annual Income. Now, try to select “Cycle Fields” from “Analysis” menu. Note that the order changed to: Annual Income – Gender – Marital Status. Click Again on “Cycle Fields” and the order will change to: Annual Income – Marital status – Gender.
Note: This feature will work with any graph type but you need to make sure that selected graph allow using more than 1 dimension (at least 2)
Some Use Cases:
In this section i will illustrate 2 use case for Tableau Cycle Fields feature.
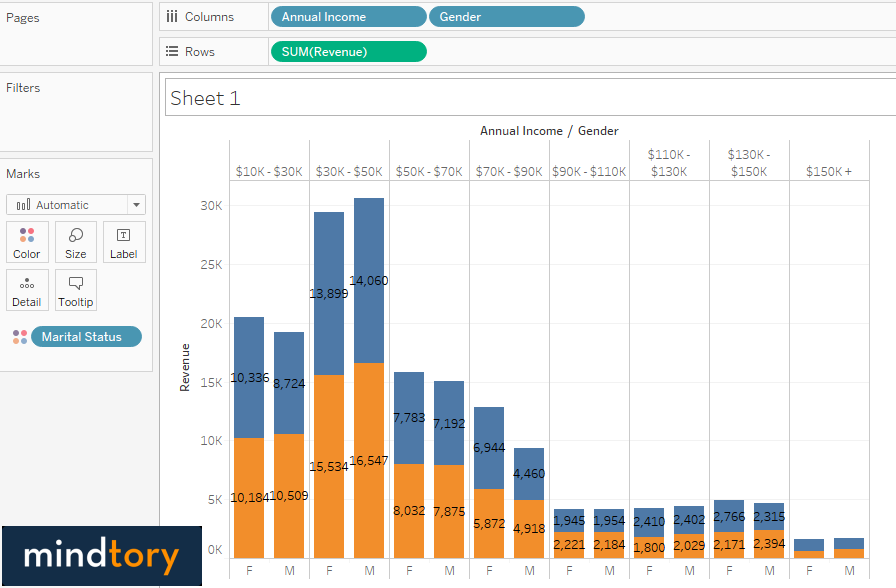
Stacked Bars
In the following example we can see revenue by Marital status, Gender and Annual Income. The gender used to color stacked bars in this case. Let’s assume that we are not sure which dimension is the best one to be used as a color for stack bars. Here cycle Fields comes as a handy feature that allow cycling through available dimensions. In our case you may need to use cycle fields 3 times to see all combinations of the selected dimensions.
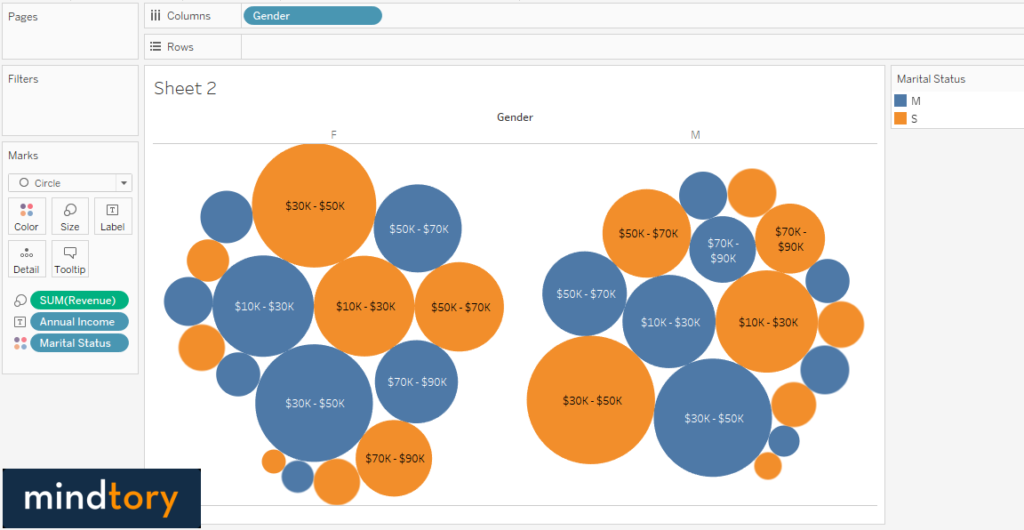
 Packed Bubbles
In this use case, i will use the same information but represented by packed Bubble chart. After using Cycle Fields, i assume that this combination contains the best insight: