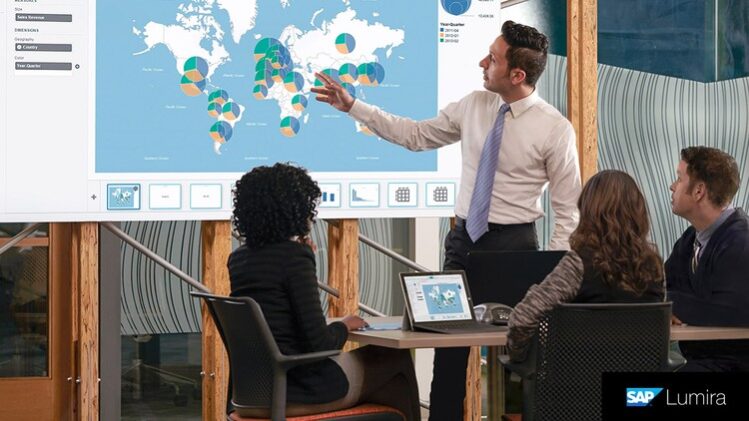
In this course you will learn how to use SAP Lumira as a modern BI tool to create outstanding visualization. We will start with an introduction section on how to download and install SAP Lumira then how to get the data set that we are going to use through this course. Then we will focus on how to create a data connection in the 2nd section. We will explain different types of available data connection. after that we will go deep in how to prepare your data before visualizing it. then we will learn how to visualize information using SAP Lumira, creating amazing stories and finally how to share them.
Introduction to SAP Lumira
This is an introduction to our Full Track series of this course, Business Intelligence, SAP BI portfolio and SAP Lumira
This is an introduction to the 5 main steps required to create and share any SAP Lumira Visualization.
Navigate and explore some SAP Lumira samples to be familiar with the expected output and what are you going to learn to create by end of this course.
Test your Knowledge...
Step # 1 - Connect to a Data Source
Introduction to our data set that we are going to use through this course.
Create a data connection to a data source. like External files, Big Data, SAP sources and Universe
This Quiz is to test your understanding of the topics illustrated in this section
Step # 2 - Data Preparation
Learn the basics of business layer. what i s the different between dimension and measure.
Learn how to use different options in the preview panel.
detail explanation to available preparation actions set # 1
detail explanation to available preparation actions set # 2
This Quiz is to test your understanding of the topics illustrated in this section
Step # 3 - Data Visualization - Charts
How to use single value - numeric points?
How to use Multiple Value charts?
Using colors to add more insight to your visualization
learn how to use trellis to group information in more informative way.
Walkthrough other charts available in SAP Lumira
This Quiz is to test your understanding of the topics illustrated in this section
Step # 3 - Data Visualization - Maps
Geo Bubble Maps
Geo Chorophleth and Geo pie maps
Esri Maps
This Quiz is to test your understanding of the topics illustrated in this section
Step # 3 - Data Visualization - Main Features
Learn how to filter information while building a visualization
Learn how to sort and rank information
Learn how to create reference line based on a fixed value and dynamic value.
Learn how to use calculations like counter, running sum, percentage ....etc
Learn how to drill up / down in a hierarchy
Learn how to export data records into Excel or CSV format
Introduction to some settings available with the application
This Quiz is to test your understanding of the topics illustrated in this section
Step # 4 - Creating Stories
Learn how to create your first SAP Lumira story
This Quiz is to test your understanding of the topics illustrated in this section
Step # 5 - Sharing
This practice test is to test your understanding for the main topics and features explained in this course. The test will help you to discover the topics that you need to spend more time to study and understand.


