All what you need to know about Dashboard?
Overview:
Before we understand a Dashboard, we must first explain the following:
- Indicator
- KPI
- KRI
- Score Card
- Report
- Dashboard
Indicator:
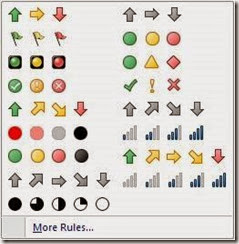
An Indicator is a visual effect or effects that can give you extra information that wasn’t included in the original figure. For example, let’s say our profit this month is 10$. You can’t judge if this number is good or bad. 10$ so what? If we have another piece of information, for example a target or average profit for the last 12 months, then we can judge how good or bad $10 is. There are many types of indicators, such as:
- Traffic light colors: (Red, Yellow, Green)
- Icons:
- Arrows: Up – Left – Right – Down
- Faces: Happy – Neutral – Sad
- Progress Bars: Empty – Half Full
Note(s):
- We can use more than one indicator at a time.
- We can use more than 3 levels. For example, 5 colors (red – orange – yellow – light green – dark green)
KPI (Key Performance Indicator):
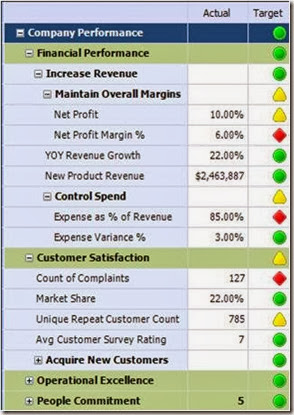
The KPI is used to measure your actual performance figures against your target. So, the KPI should at least have the following:
- Actual figure
- Target Figure.
- Indicator
- Display Mechanism (Chart)
KPI is used mainly to measure performance and should give you an immediate impression. Using indicators, you can see whether you are meeting your target. The KPI can be any type of chart. Here are some examples:
KRI (Key Risk Indicator):
The KRI is similar to the KPI, having only a few differences:
| Feature | KPI | KRI |
| Measuring | Performance | Risk |
| Against | Target | threshold |
You want a KRI with an alert system. The system can be set to trigger under certain circumstances, and then alert you via e-mail or SMS message. The KRI allows you to act immediately when a risk is triggered.
Score Card:
A Score card is a group of related KPI’s that contribute to achieving one big goal. There are 2 types of score cards:
- Balanced: This type of Score Card is evenly weighted, meaning that every KPI under this goal has the same level of importance. When you calculate your percentage of achievement for your goal, you just take the average.
- Unbalanced: With this type of Score Card, every KPI under the enterprise goal has its own weight. The sum of all weights should be 100%, and when you calculate your percentage of achievement for your goal, you should factor in each value’s weight.
Report:
A Report is a summary, or detailed information displayed in tables or charts.
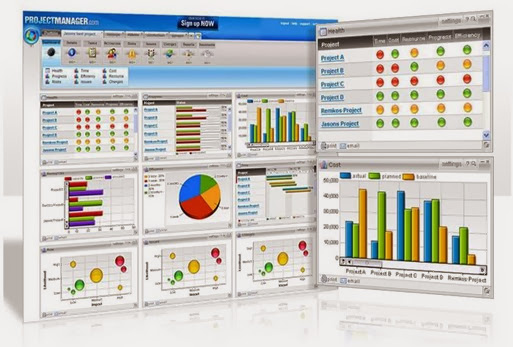
 Dashboard:
A Dashboard is a view that contains any number of the components listed above. The typical dashboard should be customized per business user; however, different Dashboards may use the same components. For example, you may implement KPI in many different dashboards. Any Dashboard can contain a KPI, a KRI, Score cards and Reports.